
Topic collection
Social Media Reporting guides
A social media report should help a reader understand what changed, why it matters and which decision follows. These guides cover reporting cadence, executive summaries, dashboards, client communication and quality assurance for recurring updates.
Select the reporting cadence that matches the decision cycle. Pair the report template with the data-storytelling guide and final QA checklist so definitions, dates, calculations and recommendations can be reviewed together.
Write an Executive Social Media Report That Leads to a Decision
An executive social media report should let a leader make a specific choice with a clear view of the evidence.
A Weekly Social Media Report for Fast, Specific Decisions
A weekly social media report should help the team adjust the next week of work.
A Monthly Social Media Report That Separates Movement From Noise
A monthly social media report should distinguish meaningful movement from ordinary variation and explain what that movement means for the next plan.
Build a Quarterly Social Media Report With an Explicit Date Window
A quarterly social media report needs an explicit date window that remains fixed through analysis, follow-up questions, exports, and later review.
A Social Media Board Dashboard With Clear Business Context
A social media board dashboard should connect the social program to business priorities, material risks, and decisions that require leadership attention.
Social Media Reporting Tools: What to Automate and Review
Evaluate social media reporting tools with failed-report tests, data definitions, review controls, export checks, and a practical automation boundary.
Agency Client Reporting: Make Scope and Recommendations Easy to Review
Agency client reporting should make the agreed scope, observed results, and proposed next work easy to review.
Social Data Storytelling: Explain the Finding Without Overstating the Evidence
Social data storytelling should help a reader understand a finding and decide what to do with it.
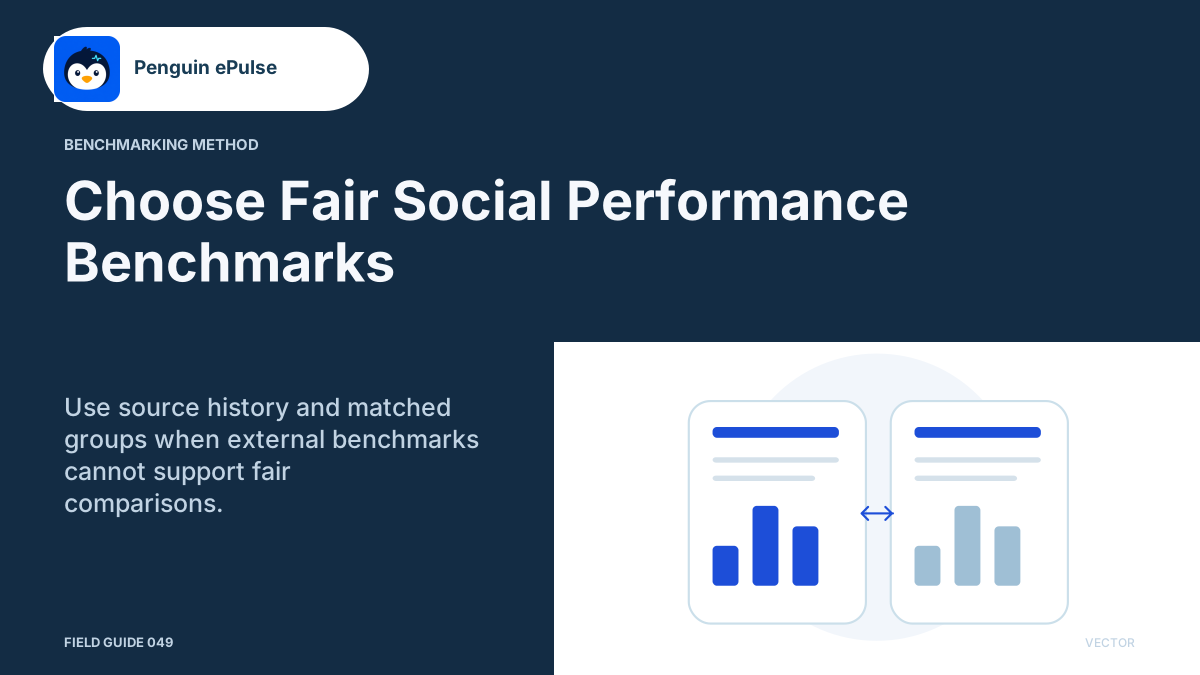
Social Media Benchmarking When a Fair Benchmark Does Not Exist
Social media benchmarking is useful only when the comparison is relevant to the decision and its differences are visible.
Social Report QA: Validate the Export Before It Leaves the Team
Social report QA verifies that the report a recipient receives represents the intended accounts, dates, definitions, and evidence.