
Penguin ePulse insights
Better questions.
Clearer social decisions.Page 3 of 7
100 practical guides to social analytics, brand listening, reputation management and marketing operations.
Showing 31–45 of 100 guides · Page 3 of 7
Instagram Analytics: Evaluate Content With the Right Context
Evaluate Instagram content with matched formats, clear metric definitions, publication age and audience context before deciding what to repeat.
Facebook Analytics: Build a Useful Page Performance Review
Build a Facebook Page review around verified source definitions, distribution context, audience actions and a concrete content or service decision.
LinkedIn Analytics: Measure a B2B Page Beyond Impressions
Measure a LinkedIn B2B Page through content, visitor and follower evidence, with clear click definitions, audience context and qualified inquiry limits.

YouTube Analytics: Connect Audience Retention to the Content Decision
Use YouTube audience retention, traffic sources and content context to choose an editing or packaging test without overreading views or curve shapes.

Short-Form Video Analytics: Read the Viewing Pattern Before the Total
Short-form video analytics should explain how attention develops, where it breaks, and whether the video achieves its intended job.
Cross-Platform Social Analytics: What You Can Compare and What You Cannot
Cross-platform social analytics is useful when it compares decisions that share a clear definition.
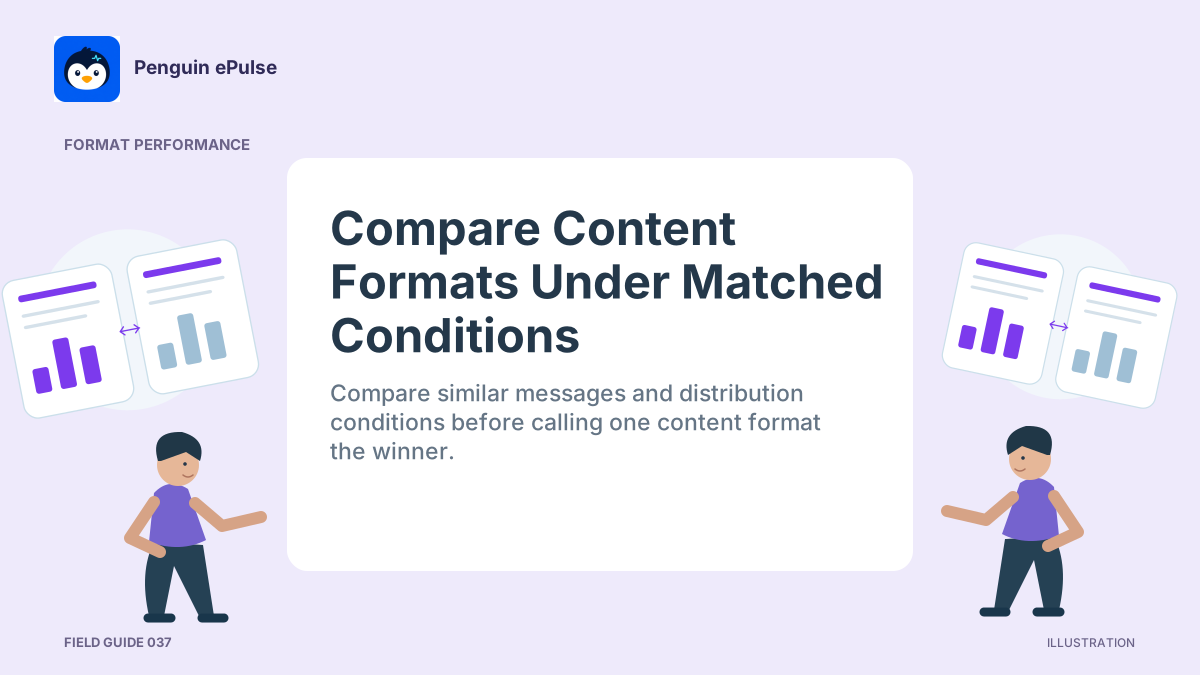
Compare Social Content Formats Without Confusing Format and Distribution
Content format performance analysis asks whether a format helps a particular message do its job.
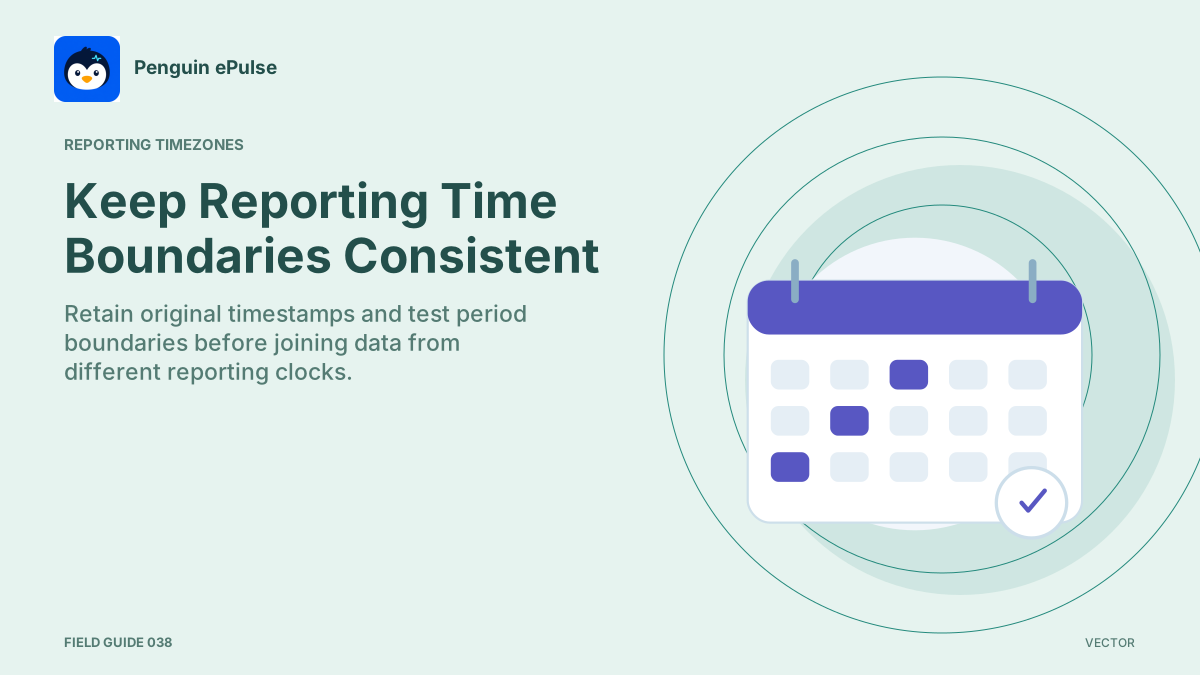
Social Reporting Timezones: Prevent False Changes at Period Boundaries
Social reporting timezones determine which day and period an event belongs to.
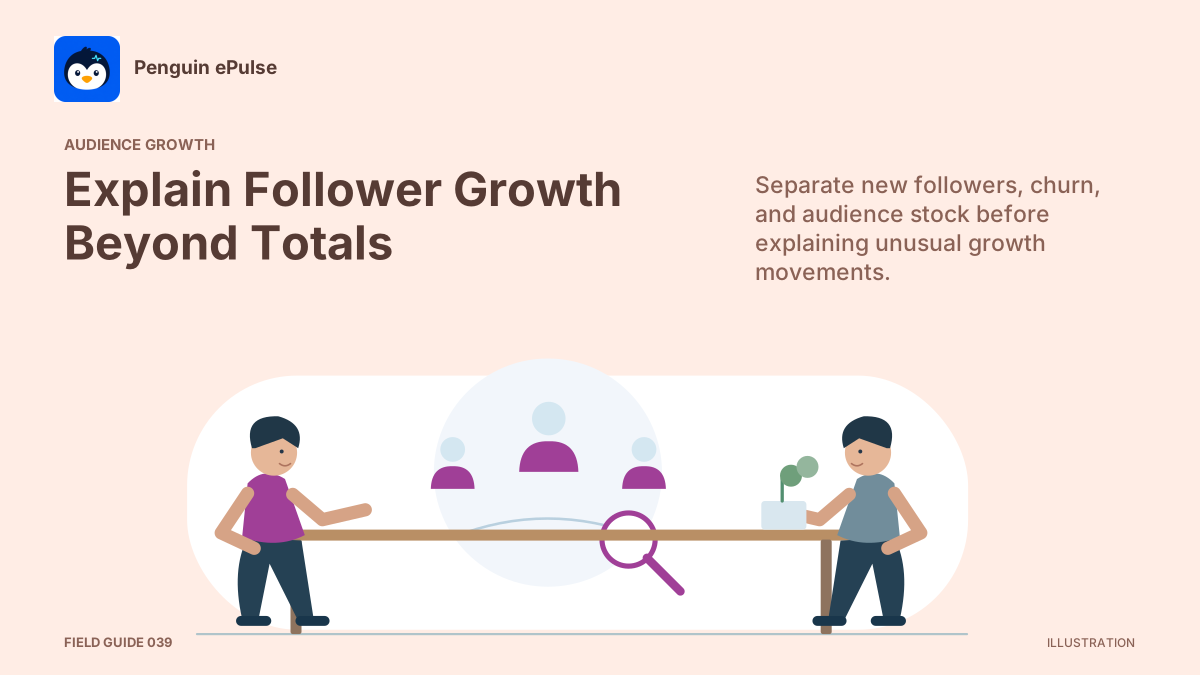
Follower Growth Analysis: Look Beyond the Net New Number
Follower growth analysis should explain the movement behind the net change and the relevance of the audience being added.
Social Audience Quality: Evaluate Relevance Without Inventing a Score
Social audience quality means the observed relevance of an audience to a clearly defined brand objective.
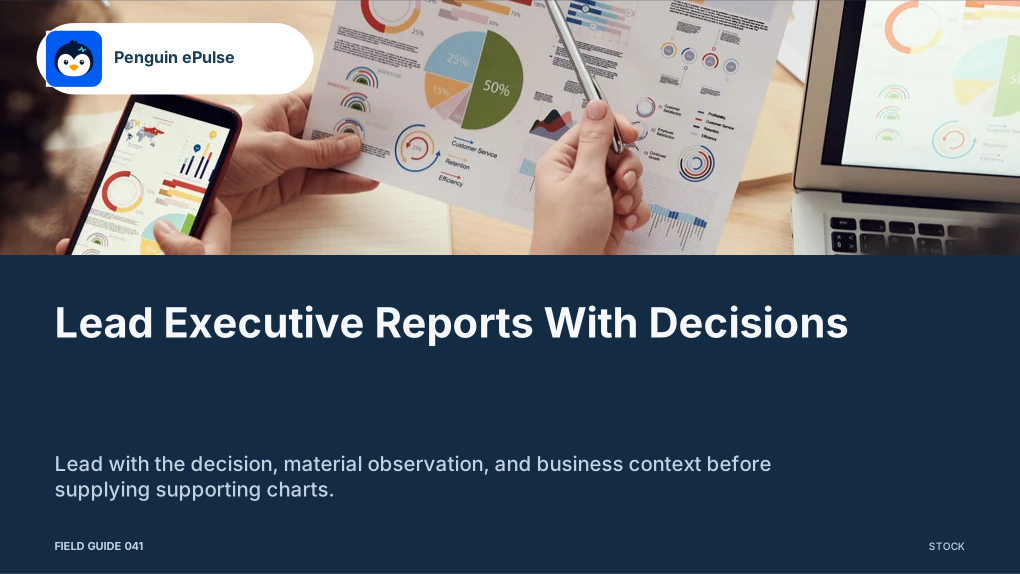
Write an Executive Social Media Report That Leads to a Decision
An executive social media report should let a leader make a specific choice with a clear view of the evidence.
A Weekly Social Media Report for Fast, Specific Decisions
A weekly social media report should help the team adjust the next week of work.
A Monthly Social Media Report That Separates Movement From Noise
A monthly social media report should distinguish meaningful movement from ordinary variation and explain what that movement means for the next plan.
Build a Quarterly Social Media Report With an Explicit Date Window
A quarterly social media report needs an explicit date window that remains fixed through analysis, follow-up questions, exports, and later review.
A Social Media Board Dashboard With Clear Business Context
A social media board dashboard should connect the social program to business priorities, material risks, and decisions that require leadership attention.
No matching guides.